Second Quarter Report of NFT Market
With the ending of June, the second quarter of 2021 is left behind. It can be said that the cryptocurrency market is in a rather pessimistic period in the second quarter. Following the decline in cryptocurrencies prices, there were serious volume decreases in DeFi platforms operating in the sector. In addition, the number of active wallets using cryptocurrencies showed significant decreases. The NFT sector, maintaining its stability during the second quarter when many indicators remained negative and unfortunate news came one after another, attracted a great deal of attention. In this article, we will analyze the second quarter performance of the NFT sector, examining the graphs created by considering various parameters.
Wallet Statistics
The trading statistics of NFTs and the monetary size created by such trade are of great importance in terms of showing whether the sector is dynamic or not. The chart below compares last year’s second quarter statistics (left column), first quarter statistics of 2021 (middle column), and second quarter statistics of 2021 (right column). Although comparisons with the same period of the previous year are overall fruitful, we will only consider the first and second quarters of 2021 in this analysis. While the first quarter represents a period in which the crypto market shows a quite aggressive uptrend, the second quarter, on the contrary, represents a sharp decline. Therefore, analyzing the NFT sector within these two market trends, which are poles apart, will yield quite sufficient results.
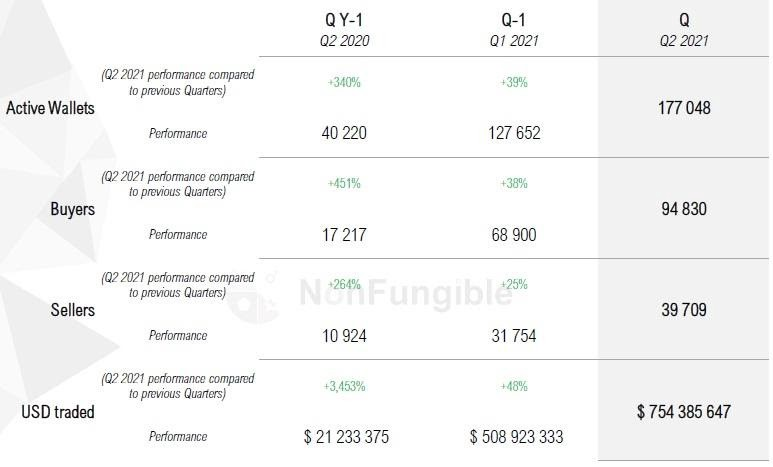
- The first statistic in the table shows the number of active wallets. Meaning that every wallet that creates volume in the NFT sector, whether buying or selling, is represented. The number of active wallets in the second quarter increased by 39% compared to the first quarter. Each wallet does not represent a single person. This is because users can have multiple wallets. Therefore, although the rate of new entrants to the market has not increased by 39%, it can still be assumed that there has been a significant increase in this period when the crypto market is declining. Among the reasons for the increase in the number of wallets is the decrease in cryptocurrency prices. Users who wanted to buy NFT products before, but found the prices expensive, may have shown extra interest in NFT products during this period, as NFT products whose prices are not updated became cheaper.
- Buyer and seller statistics have both shown an increase compared to the first quarter. The number of wallets buying NFT products increased by 38%, whereas the number of NFT-selling wallets stood by 25%. So, the increase in the number of active wallets is fairly evenly distributed. Such an increase between buyer and seller indicates that the industry’s appetite is still high and demand for NFT products continues aggressively.
- As the last point, the trade volume in USD terms increased by 48% in the second quarter. Parallel to the increase in the number of wallets, there was a significant increase in the amount of money pumped into the sector. Moreover, although the prices of NFT products were updated due to the decrease in cryptocurrency prices in the second quarter, there are products still sold at the same price. This in return causes the products to become cheaper in USD terms. Despite this, it is estimated that such an increase in USD terms may reach higher rates in an environment where there is no decline in the market.
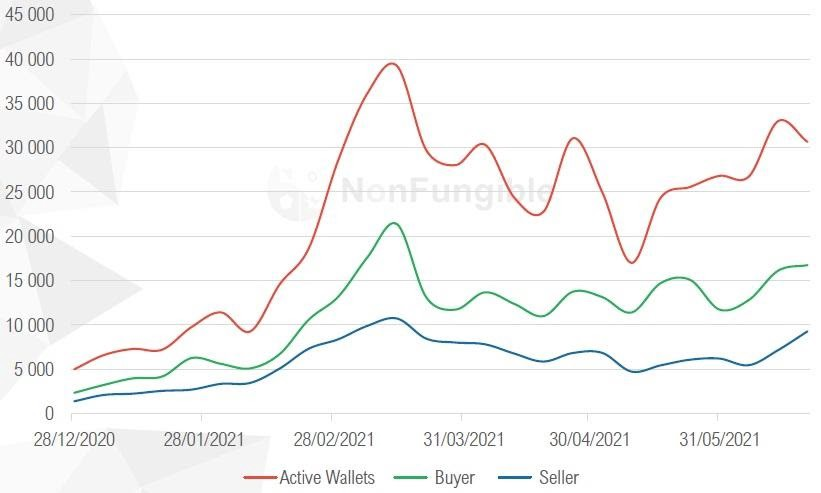
The chart above shows the trend’s tendency across wallets. The red color indicates all active wallets, whereas the green color represents the buyers and the blue color sellers. According to the chart, the number of active wallets averages around 25–30 thousand. Also, wallets that buy NFT have always outnumbered the selling wallets. This points that the market is far from saturation point and NFTs produced still attract high interest. In the case of higher numbers of wallets that sell, one can say that existing users in the market have enough NFTs and want to dispose of products to make a profit. This indicates that the demand is saturated. As there is no such signal in the chart yet, it is expected that the sector will continue its current uptrend.
Dapps vs. P2P
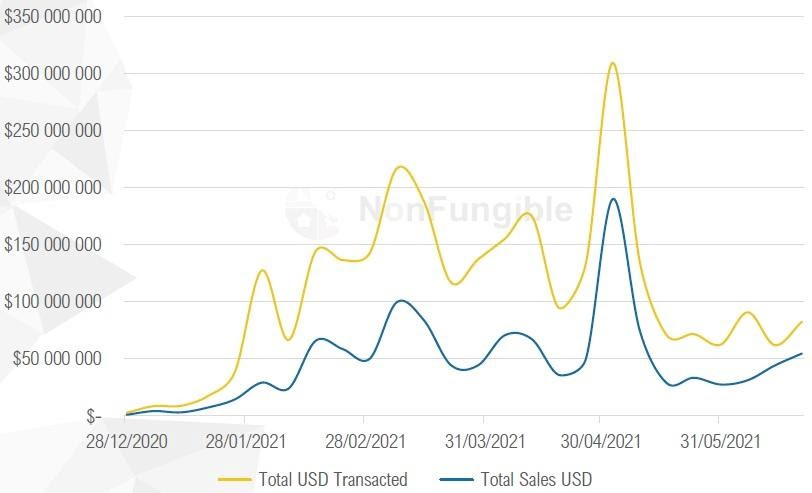
The chart above compares the volume performed on NFT-based applications with the volume of NFT trading from wallet to wallet. To give an example, a game played using NFT products is an NFT-based application. A digital artwork purchased from any NFT product marketplace, however, is a wallet-to-wallet trade. The yellow trend line on the chart represents volume on apps, while the blue line represents wallet-to-wallet transfers.
The yellow color being more dominant in the graph is very positive for the sector. This is because it shows that the NFT industry can successfully carry not only a formation that runs through certain objects such as works of art but also an ecosystem that offers functionality through various applications. In this way, it is seen that the sector has become much more comprehensive, not only by those producing NFT products but also by alternative projects that provide infrastructure for such products. The high level of application-based NFT trading is also of great importance for sustainable demand.
Usage Frequencies
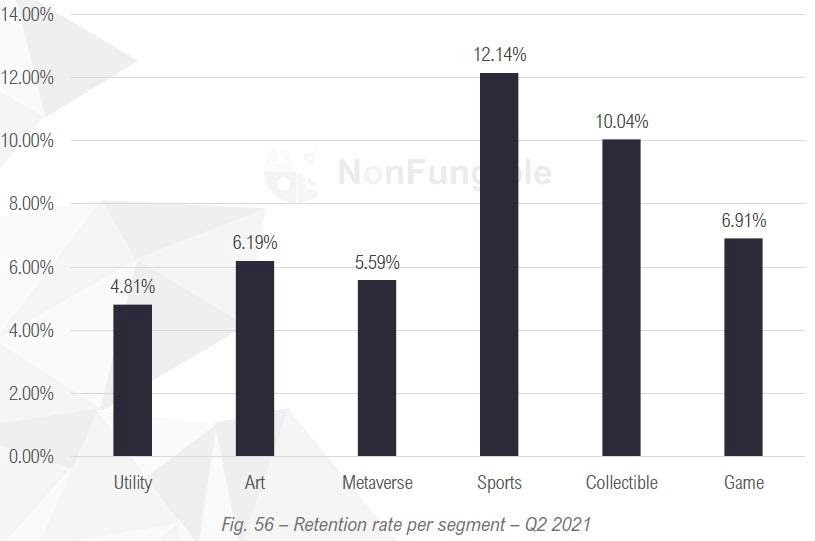
Although the volume of NFT applications is high in the previous chart, the frequency of users using these applications is quite low. In the chart above, the frequency of use of applications is divided into categories. The above rates were determined by evaluating the applications that users use every day as 100% and the applications they use every 6 months as 1%. As can be seen, users often use applications from time to time for the purchase and sale of NFT products. However, it can be easily said that the applications used every day do not constitute the majority. At this point, it can be expected that the gaming industry will have a higher frequency of use in the future, led by games such as Axie Infinity or Gods Unchained.
Distribution of NFT Sectors in USD
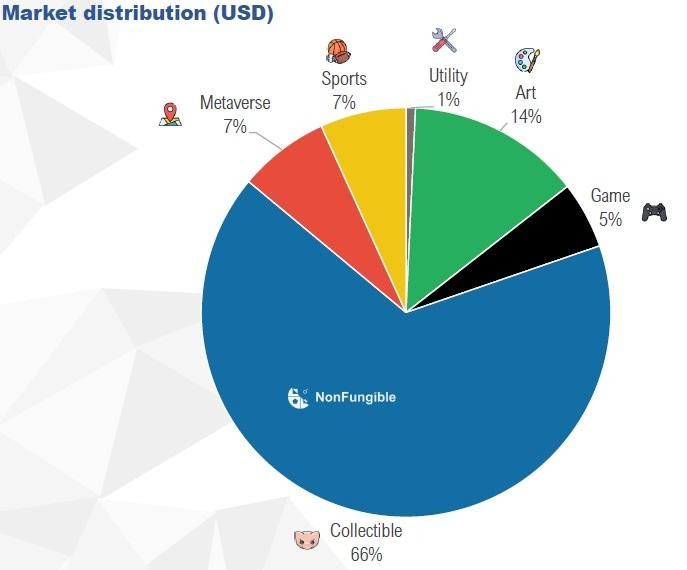
The NFT sector consists of products that are subject to purchase and sale for collector purposes at a rate of 66%. Examples of these products are avatars such as Hashmask, MeeBit. Such products, which possess a certain demand and fan base, find buyers at high prices, especially in second-hand sales. In USD terms, the popularity of collectable products is clearly seen, while the chart below points that sports and utility products are also very popular in terms of the number of trades.
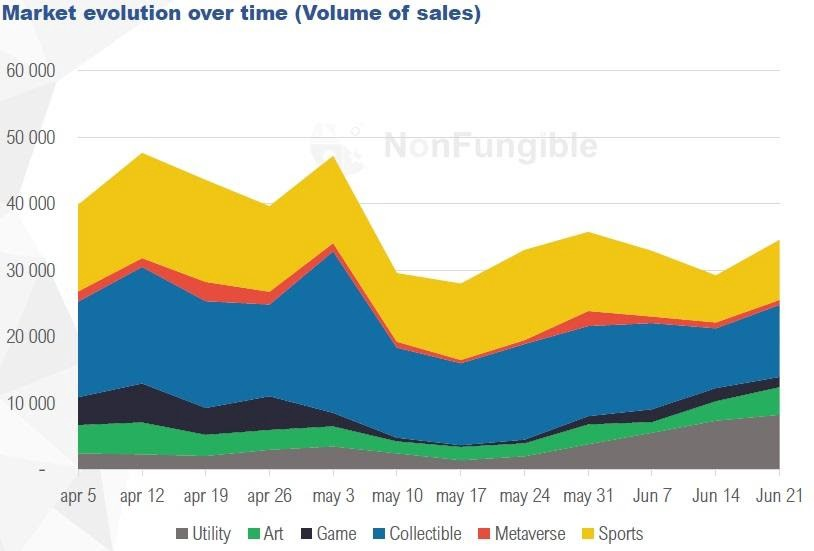
The second-quarter chart above not only shows which sector is superior in terms of sales but also allows us to examine the response of the NFT sector to the decline of cryptocurrencies. After reaching their peak at the beginning of May, the sales figures showed a partial decline, but recovered soon after and continued their course between 30,000 and 40,000. Therefore, we can clearly say that the NFT sector was affected by the downtrend at first, but it took a very strong stance afterwards and did not lose the demand it had. Two important factors stand out among the reasons for this. The first is that the advertisement of the NFT sector is supported by famous names and brands. The world-famous Dolce & Gabbana’s announcement that they will enter the NFT sector, Anthony Hopkins’ new movie being planned to be released as NFT, and the NFT advertisements of the popular and reliable names and brands may have ensured the industry to be minimally affected by the market decline. The second possible factor is that users who want to buy NFT products that have become cheaper with the decrease in cryptocurrency prices have entered the sector.
First and Second Hand Sales by Sectors
Below, first and second hand sales for each sector are evaluated both in USD terms and in terms of a number of sales. The pie charts on the left show the weighting in USD, whereas the pie charts on the right show the weighting based on the number of trades.
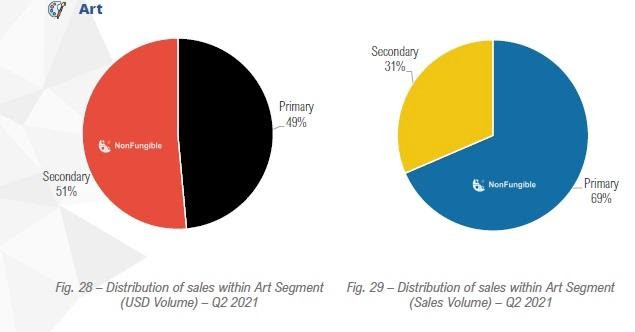
In terms of the number of sales, although the NFTs, which are works of art purchased directly from the creator of the work dominate by 69%, the sales density of 31% in the second-hand market holds the advantage of 51% in USD terms. This shows that the works sold in the second hand market can be sold with a certain increase in their prices, although not at a very serious rate. It can be said that people who sell in the second-hand market generally earn more than the creator of the work.
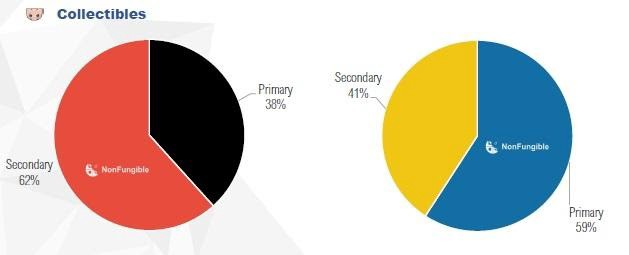
NFTs purchased for collectables are 59% purchased directly from the owner and 41% sold second hand. Despite this fact, the second-hand market in USD terms is dominant by 62%. It would not be wrong to say that the same situation in the category of works of art in the previous graphic applies to collectables.
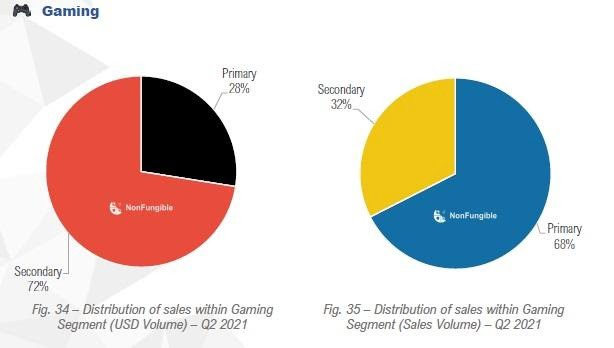
The gaming industry also has shown similar statistics to the two industries above. However, the superiority of the second-hand market in the gaming industry in USD terms is much sharper. The second hand market, which has a share of 32% in terms of the number of sales, is dominant by 72% in USD terms. This shows that the NFTs purchased are exchanging hands at a very high price. Various gaming platforms promise some quests and rewards to users to encourage trade. Quests usually come in forms in which people collect certain cards that have already been released and thus complete the collection. It is possible for the products in the games to find buyers at higher prices by attracting high demand as a result of such quests. This may be the reason behind the USD-based dominance of the second-hand market in the chart.
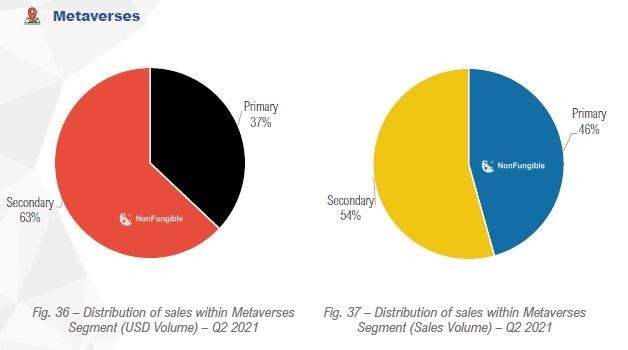
Metaverse, that is, virtual worlds where NFT products are used, is one of the most mature sectors in terms of statistics. Metaverses, which have an almost equal appearance in terms of the number of sales, do not have a serious gap when viewed in USD terms. It is quite common for the secondary market to have a partial advantage in USD terms. Products that have become cults or advertised may attract more demand as time goes on.
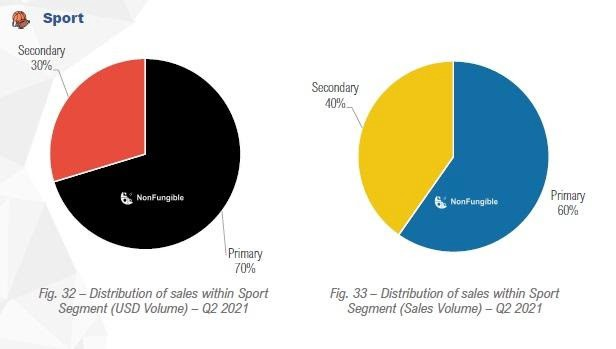
Sporting goods display a structure quite different from the previous sectors and have graphics where first-hand sales are superior in terms of both the number of sales and USD size. In other words, users who buy sports products are not willing to sell these products in secondary markets, failing to make a significant profit from such sales even if they want to. This situation may also be triggered by the fact that sports NFTs have not yet attained a cult status or the demand for old products has decreased as a result of new platforms constantly introducing new products to the market, a result of the high demand in the sports field. Therefore, it cannot be said that sports NFTs attract a very high demand but have not reached a mature market yet.
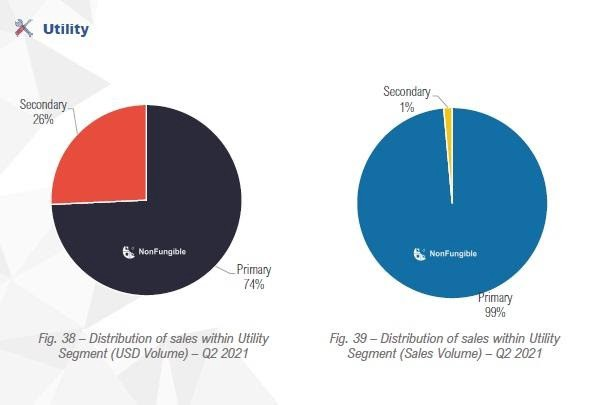
The utility is almost entirely dominated by the primary market in terms of sales. It cannot be said that the secondary markets have much effect in USD terms. Utility stands for functional NFT products. Examples of these products include Ethereum Name Service NFTs, one of the most popular utility NFTs. These NFTs enable the naming of Ethereum addresses. For example, instead of a cryptographic wallet name like 0x12nj2nj1…, you can name your wallet as Berkay. For this reason, since utility products are already purchased for a specific need, they are less likely to be sold to someone else. The purpose here is to meet a specific need rather than profit motivation.
****
The various parameters and charts above show that the NFT sector left the second quarter behind very positively and the aggressive demand continues. Sub-sectors within the NFT sector have various levels of maturity, and the popularity of applications related to these sectors allows the NFT sector to spread to many wider areas. The moves made by various world-famous names and brands on NFT in the very early period also carry promising signals for the market. The investments of famous names in the field of NFT also stem from the desire to compensate for the economic damage that occurred following the coronavirus outbreak which affected the entertainment and art world the most.
The graphs and statistics in this report are obtained from the 2nd Quarter report of nonfungible.com. Click to access the original version of the report.
Written By: Berkay Aybey
The opinions and comments expressed here belong to BV Crypto. BV Crypto cannot be held responsible for any financial transactions made on the basis of this post. Every investment and trading move involves risk. When making your decision, you should do your own research.
