Third Quarter and Geographical Report of Crypto Market
The third quarter of the year ended in September. As every year, various statistics about the cryptocurrency market have been published this year. In this article, you can find answers to the questions of where, how much and how cryptocurrencies are used in the world, with a summary of the important data on the performance of the crypto market in the 3rd quarter and various graphs on the geographical analysis of the crypto market.
3RD QUARTER REPORT
Performance Comparisons
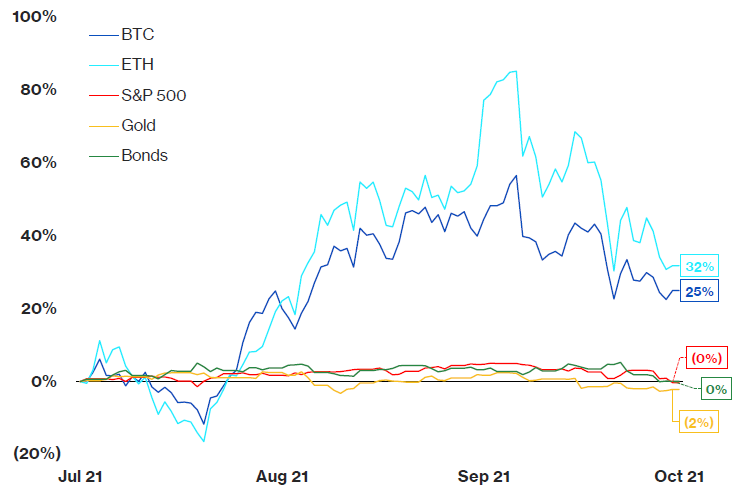
BTC and ETH prices vs. the S&P 500, gold and bond returns have been compared in the representation of the crypto market vs. the traditional market. As can be seen on the chart, BTC and ETH achieved a very good rate of return in Q3 compared to the traditional market. One of the reasons for the increasing interest of institutional investors in cryptocurrencies is that they do not want to waste more time with investments in traditional products that bring a return of around 0%.
Correlation
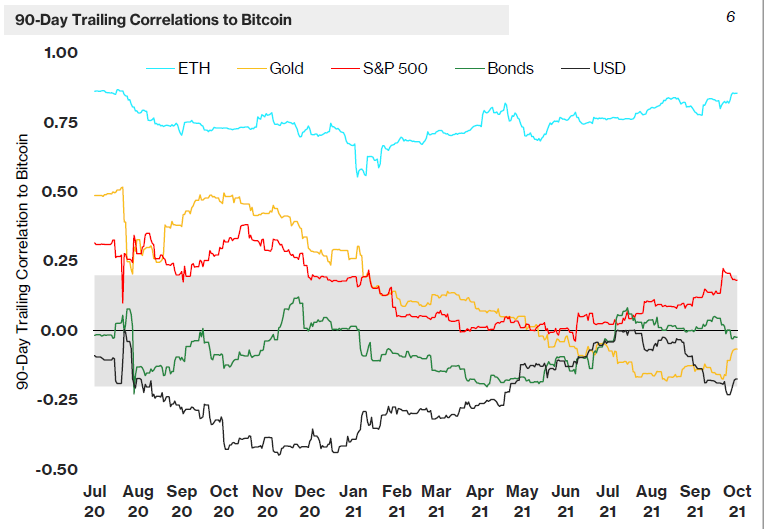
Bitcoin’s correlation rate with other financial products is a metric that has been followed for a long time. As seen on the left side of the chart, even though Bitcoin is occasionally positively correlated with Gold and S&P500, and negatively correlated with USD, it is not highly or consistently correlated. It can be said that Bitcoin mainly has its own dynamics. With the increase in BTC investments from institutional companies, the correlation between the traditional market and BTC can be expected to increase in the upcoming years.
Lightning Network
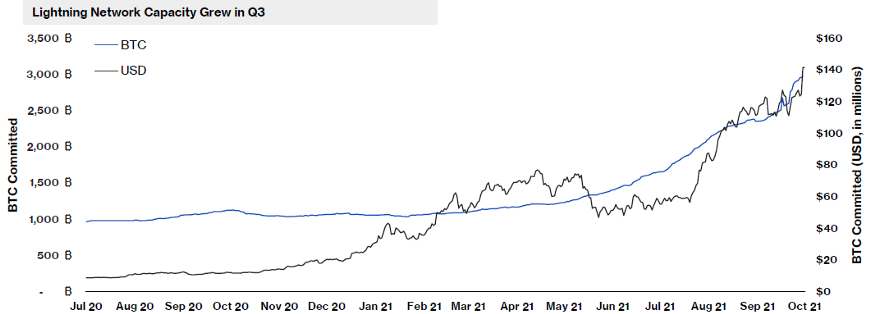
Bitcoin transfers are completed in an average of 40 minutes to 1 hour. With the Lightning Network system, however, BTC transfers take place only within seconds. This means that BTC can be used for daily spending. The Lightning Network grew 97% as El Salvador began accepting BTC payments in practical life. The total size of confirmed transactions on the network has exceeded the 2900 BTC level. El Salvador is not the only reason for the growth, but it can certainly be said that it has given an impetus to this growth.
Bitcoin Transaction Fees
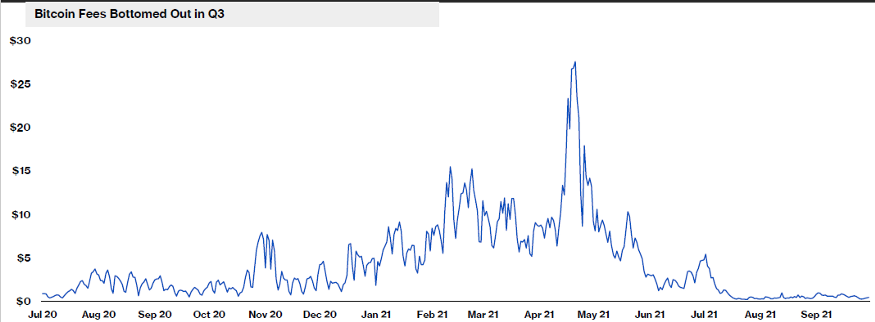
For each transaction on the Bitcoin network, a certain amount of commission is paid to the miners. Commission fees paid to the miners peaked in May as more and more BTC transfers took place after February — March when BTC first crossed the $60,000 mark. Today, although BTC has risen to over $60,000 again, its network density is quite low. The amount of commission miners receive is also at the minimum level as seen in the chart. While the high number of transactions on the Bitcoin network is a good sign of increased use of the network, it also involves the risk of price bubble. Therefore, it can be said that the current rise has not yet given a bubble signal.
Amount of Burned ETH
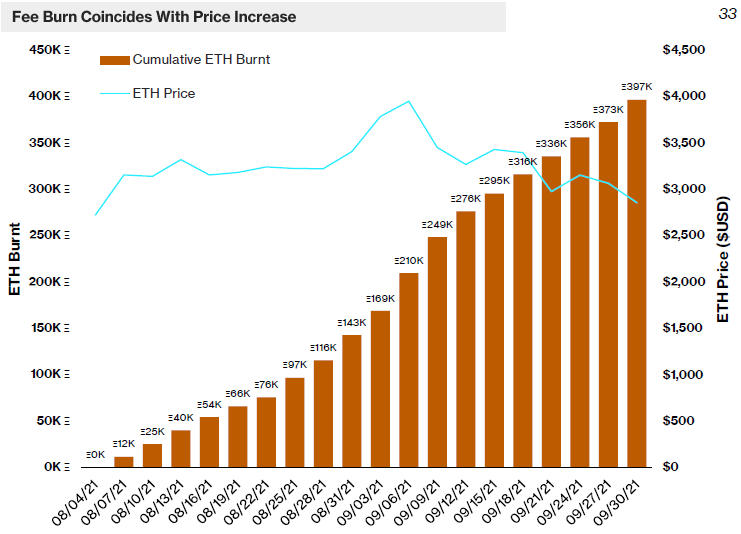
The Ethereum network started burning some of the commission paid to the miners as transaction fees after the London Upgrade. The amount of burned ETH increased rapidly due to the density of the Ethereum network. Approximately 400 thousand burned ETH has significantly reduced the increase rate of ETH supply. From time to time, when the transaction intensity was too high, the amount of burned ETH exceeded the amount of produced ETH, which led to a deflationary outlook. As a result, the aggressive increase in the amount of burned ETH is expected to have a positive impact on the price of ETH.
Gas Stabilization
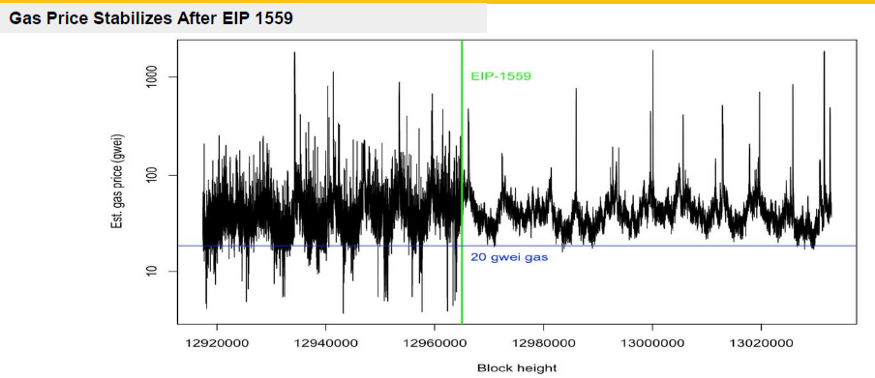
The green line in the middle of the graph separates the before and after London Upgrade. Gas prices, which were highly volatile before the development, stabilized in a range of 20 to 100 after the development (ignoring the peaks). It can be said that a better outlook has emerged in terms of transaction costs in the Ethereum network.
The Total Value Locked (TVL) on DeFi Platforms
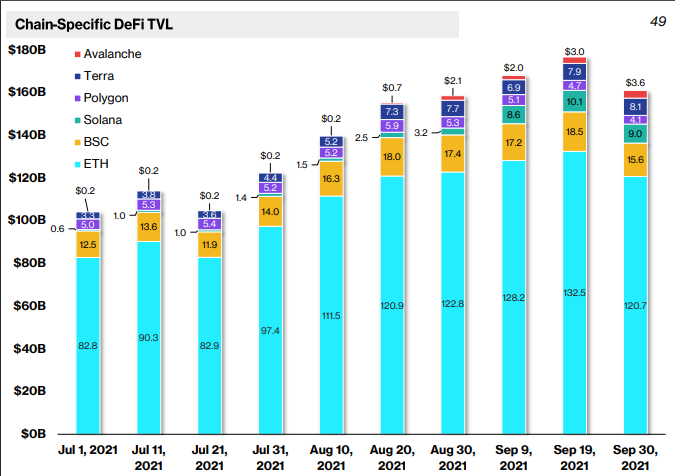
With the increase in the transaction cost on the Ethereum platform, alternative blockchain networks and L2 solutions have recently become popular. DeFi applications on these platforms also collected considerable sums. Despite this, it can be seen on the chart that the assets on Ethereum did not decrease at a serious level. It seems that the balances on new DeFi applications come from completely new investors. So it can be said that there is no escape from the Ethereum network. It can be said that the investment strategies of the investors are both to benefit from the high rates of return on the new platforms and to invest early in a network that has the potential to become a second Ethereum.
Application Revenues
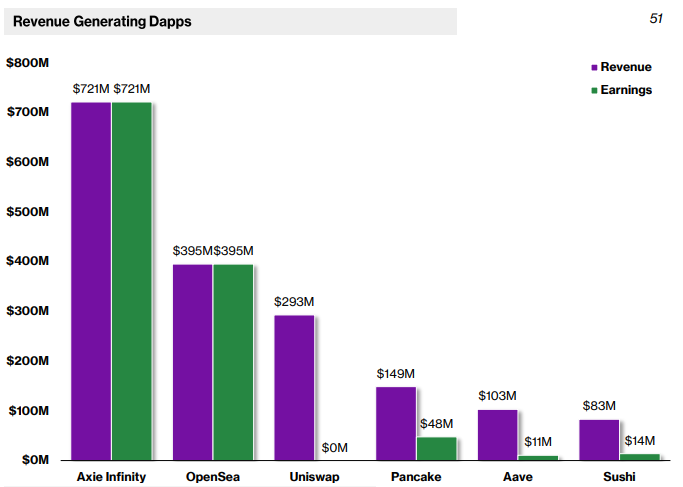
When the revenues of the applications are listed, it is seen that the applications related to NFT take the first two places. Axie Infinity can be given as an example of the first successful game involving NFT products. The revenue generated by the game surpassed that of Opensea, the largest NFT market, and Uniswap, the largest decentralized exchange. It is undeniable that NFT-based games will be one of the pioneers of the industry in the future.
Opensea’s Volume
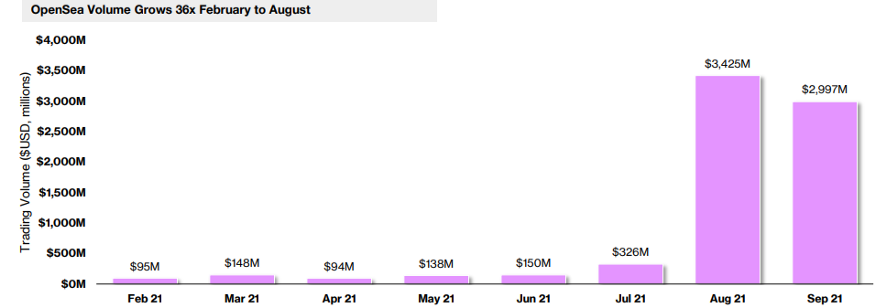
Opensea’s volume, which was only 95 million USD in February, reached 3.42 billion USD and 2.99 billion USD, respectively, in the last 2 months of the 3rd quarter. The fact that the volume boom was not limited to a single month and continued in September indicates that the current volume levels may be permanent.
GEOGRAPHICAL REPORT
Monthly P2P (Peer to Peer) Traffic
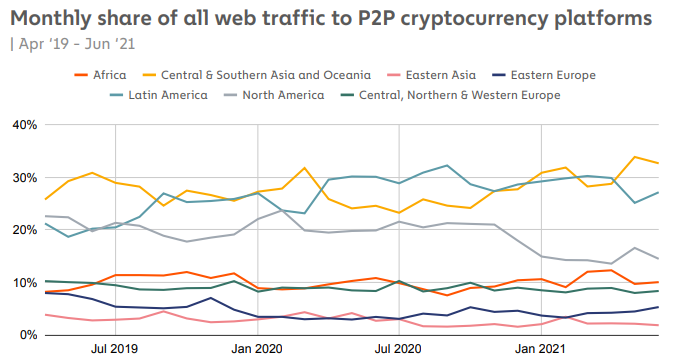
Direct peer-to-peer trading such as OTC trading, instead of trading cryptocurrencies on the exchange, play a dominant role in the market in Latin America, Central and South Asia, and the Oceania Region, and occasionally North America. P2P trading is mostly carried out in regions where countries block access to exchanges and/or have a high level of cash use. Although North America does not have a serious problem with accessing exchange, it may be at the top of this chart due to the preference for OTC trading when purchasing large amounts of cryptocurrencies.
Number of Visits to DeFi Platforms by Country
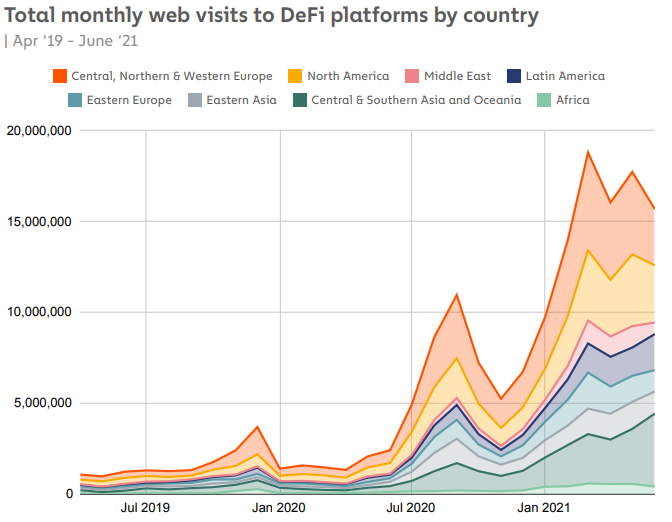
DeFi, namely, decentralized finance, is mostly used in the Central-North and Western Europe Region and North America. Next comes the Middle East and Latin America, respectively. Europe and North America’s high visit rate may be due to corporate companies’ willingness to take advantage of higher USD returns, apart from improved financial literacy. In addition, the interest in DeFi in these regions can be seen as the interest of investors who want to maintain their power in the traditional economy in the field of innovative finance.
Distribution of Investor Types in Cryptocurrency Transactions
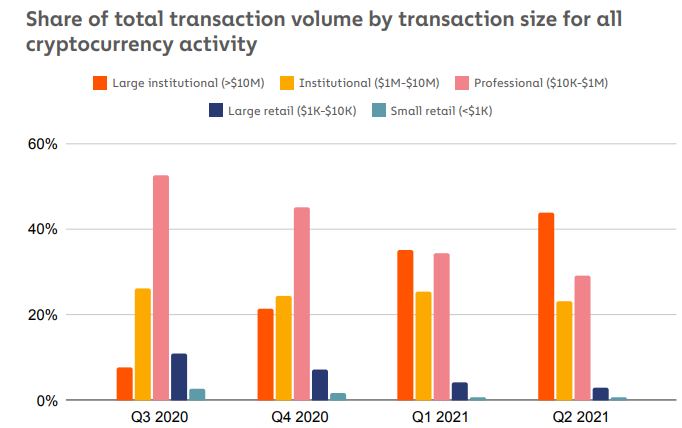
If we look at the course of the money entering the crypto market, we see that in the last two quarters of 2020, the professional investor type (10,000 USD — 1 million USD), shown with pink color, was quite dominant, while the institutional giants (10 million USD+), shown with orange color, became dominant after 2021. Therefore, it can be said that giant companies are starting to become the main players of the market and there is an increasing amount of money entering the market. We can say that the crypto market is taking firm steps towards becoming one of the mainstream financial markets.
Classification of Addresses as Centralized and Decentralized to which Cryptocurrencies Transferred to North America Are Sent
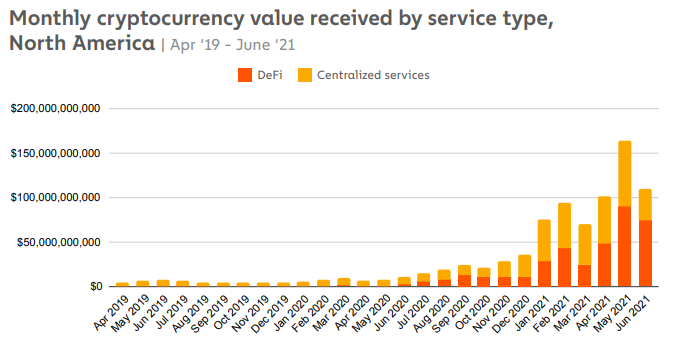
While the majority of cryptocurrencies sent to North America are sent to centralized platforms, the share of decentralized platforms in this pie has gradually increased after 2021. Considering the last two months of Q3, it can be said that crypto money transfers are mostly carried out on decentralized platforms. This chart presents a pretty clear answer as to why the SEC has started making moves towards regulating the decentralized platforms. We can say that the SEC has difficulties in regulating cryptocurrency exchange and will need to do much more detailed research and development on the decentralized exchange. In other words, it can be said that regulators have difficulty catching up with technological developments.
25 Most Used Services in North America
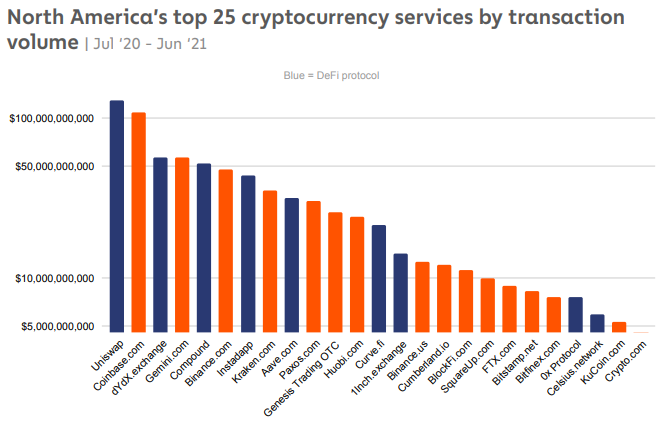
The fact that 3 decentralized platforms are among the top 5 cryptocurrency services most frequently used in North America confirms the result in the previous chart. Uniswap takes the lead in the most frequently used applications, followed by Coinbase, dYdX, Gemini, and Compound, respectively.
Comparison of Venezuela and Brazil’s P2P Transfers
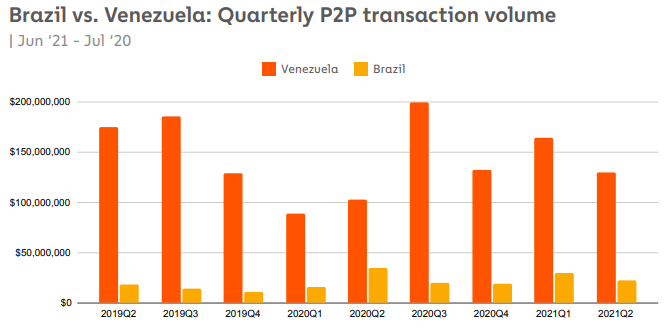
When Brazil, one of the largest economies in Latin America with a serious cryptocurrency volume, and Venezuela, which is under heavy US sanctions, are compared in terms of P2P, it is seen that Venezuela achieved a significantly higher volume in all periods. The fact that Venezuela is far ahead in volume despite being a poorer country shows that Venezuela has succeeded in circumventing the US sanctions through cryptocurrency. As a matter of fact, discussions have started recently in the USA about the weakening effect of cryptocurrencies on sanctions.
Most Traded Cryptocurrencies by Investor Types in North-Central and Western Europe
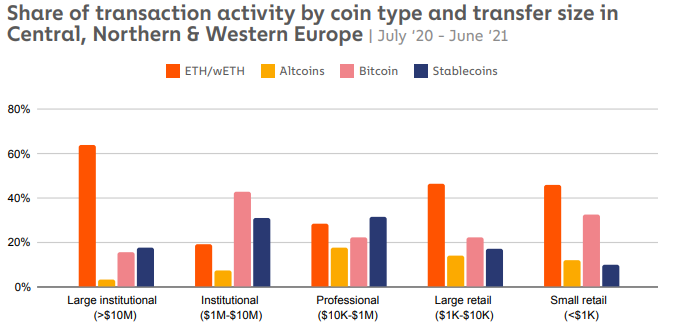
Considering the investors in the Central-North and Western regions of Europe, where the transactions are the most intense, together with North America in terms of both number and quantity, it is seen that investors with a volume of fewer than 10,000 USD carry out BTC and ETH transactions the most, whereas investors with a volume of 1–10 million USD have a balanced outlook, using Bitcoin and stable money the most. The most interesting point in the chart is that the corporate giants with a volume of more than 10 million USD are performing a significant portion of ETH trading. ETH, which has a very high rate compared to Bitcoin and stable money, is very important in terms of representing how much the institutional value the applications on the Ethereum network and the investments they make.
Distribution of Cryptocurrency Transfers in North-Central and Western Europe Regions by Services
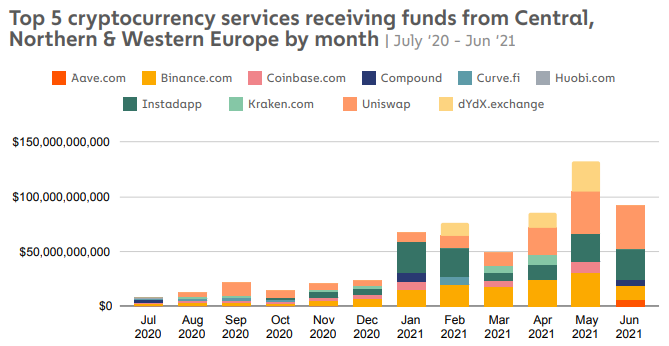
When the cryptocurrency platforms that received the highest money flow from the North-Central and Western Europe Regions in 2021 are analyzed, it is seen that decentralized platforms constitute the majority of these platforms. Decentralized platforms are arguably very popular in Europe, similar to the North America Region. Similar to the US, EU countries can be expected to gradually focus on regulating decentralized platforms in the future.
Top Cryptocurrency Sending Countries in North-Central and Western Europe Regions
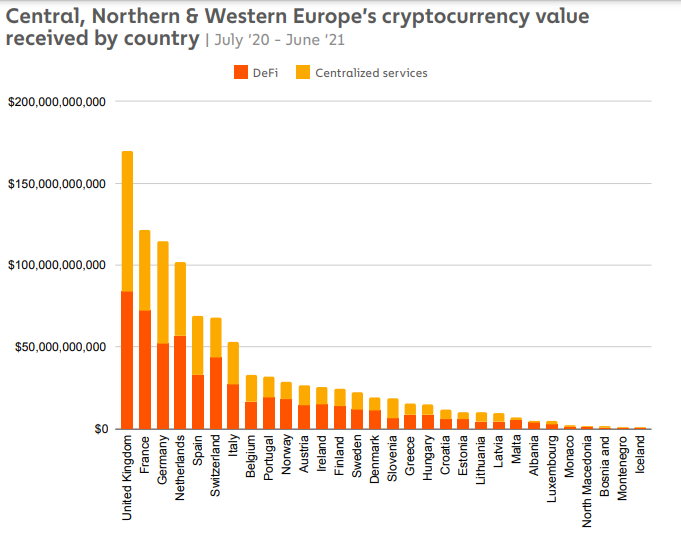
According to the chart, the United Kingdom takes the first place in the list of countries with the highest amount of cryptocurrency transfers, followed by France, Germany and the Netherlands, respectively. This ranking is also important in terms of revealing which countries the crypto trade is developing more. Central and decentralized platforms are almost equally weighted in transfers.
Countries With The Most Visits To Scam Cryptocurrency Sites
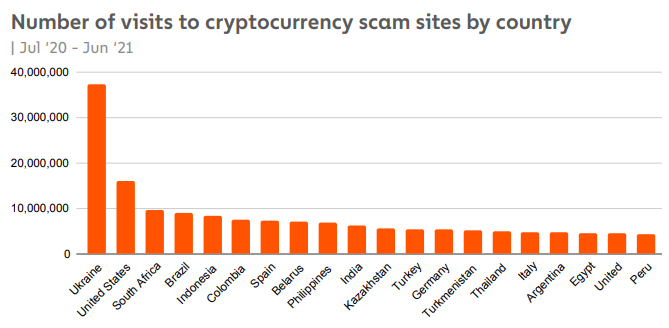
Ukraine is far ahead in the list of countries visiting scam sites. It can be said that Ukrainian users do relatively little research and their cryptocurrency literacy rate is low. US users take second place.
Distribution of Investor Types in the South Asian Region
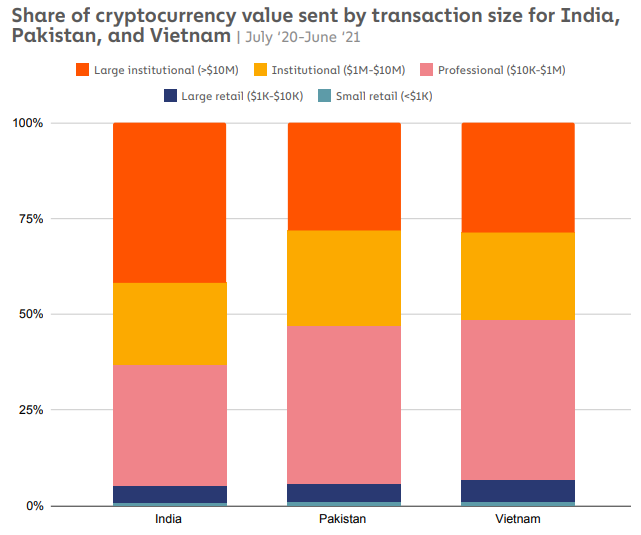
Three countries with high cryptocurrency integration, India, Pakistan, and Vietnam, are examined in this chart. Although there is a similar and relatively balanced distribution in Pakistan and Vietnam, it is seen that corporate giants are more dominant in the case of India. The dominance of these users, with a volume of over 10 million USD, shows the seriousness of India’s interest in cryptocurrency.
Most Used Cryptocurrency Services in East Asia
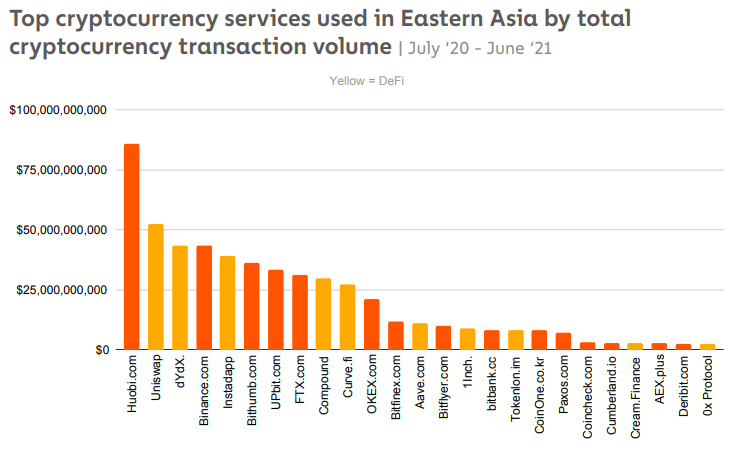
In the volume-based ranking, it is seen that the Huobi Exchange is used the most in the East Asian Region. However, similar to developed countries, decentralized platforms dominate the top 5 most popular services. Uniswap and dYdX take the second and third places, while Instadapp takes fifth place. Since China is the largest economy in East Asia, it can be estimated that the concentration on decentralized platforms is carried out by Chinese users due to China’s extensive cryptocurrency ban.
Countries With The Most Cryptocurrency In The Middle East
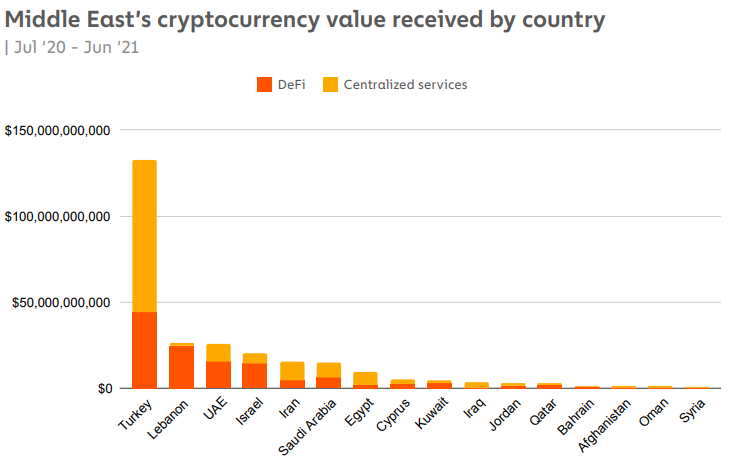
Evaluated in the Middle East Region, Turkey is the clear leader of the region. Between July 2020 and July 2021, nearly 150 billion USD of cryptocurrency transfers were sent to Turkey. It is seen that Turkish users use centralized applications the most and prefer decentralized platforms at a rate of 1/3. Another striking point in the chart is the case of Lebanon. Almost all of the cryptocurrency transfers sent to Lebanon, which ranks second, were sent via decentralized platforms. Due to the economic collapse in Lebanon, it can be said that users keep their assets on decentralized platforms.
Looking at the above statistics in general, it is clearly seen that the ongoing aggressive growth of the cryptocurrency market continues unabated. The crypto market turned a new page with DeFi platforms, and with the development of these platforms in 2021 and their deep liquidation, they have become an important alternative for regions that struggle with various economic crises. When the maturation of the regulations and the NFT market bringing new brands and investors to the crypto sector is combined with the infrastructure created by DeFi, it can be said that the market has strongly entered a new growth trend. Considering that institutional giants are just entering the market and the new branches such as DeFi, NFT, and L2 need a significant amount of time to mature, it can be said that the crypto market is still at the bottom of the ladder and constantly creates new opportunities. The fact that many countries, and therefore their people, gain financial freedom and have an alternative thanks to decentralized platforms is very promising in terms of showing what this ecosystem, which has developed under the leadership of Bitcoin, has achieved in 12 years.
* The graphs in the third quarter report are taken from CoinDesk’s report. (link)
*Graphs in the geographic report are taken from ChainAnalysis’s report. (link)
Prepared by: Berkay Aybey
The views and comments expressed here belong to BV Crypto. BV Crypto cannot be held responsible for any financial transactions based on this article. Because every investment and trading move involves risk, we advise you to do your own research when making such decisions.

Berkay Aybey
Business Analyst